Fix Core Web Vitals Issues: LCP, CLS, FID

Starting from early November 2019, the Google Search Console added an experimental speed report to the existing enhancements tools that helps webmasters discover potential user experience problems such as mobile usability. This report evolved to become known as the Core Web Vitals report, led by a Google initiative to give simplified user experience metrics to site owners.
The data used for this report comes from the Chrome User Experience (CrUX) report. The CrUX report is powered by aggregated user experience metrics from actual users visiting your website.

This report is currently based on 3 metrics:

- Largest Contentful Paint (LCP): a loading performance measurement, should occur during the first 2.5 seconds of the page loading.
- First Input Delay (FID): an interactivity measurement, should be less than 100 milliseconds.
- Cumulative Layout Shift (CLS): a visual stability measurement, should be less than 0.1.
Other metrics relating the core web vitals include:
- First contentful paint (FCP): the time from when the user requests the URL until the browser renders the first visible element in the URL. Closely relating to the FID and LCP.
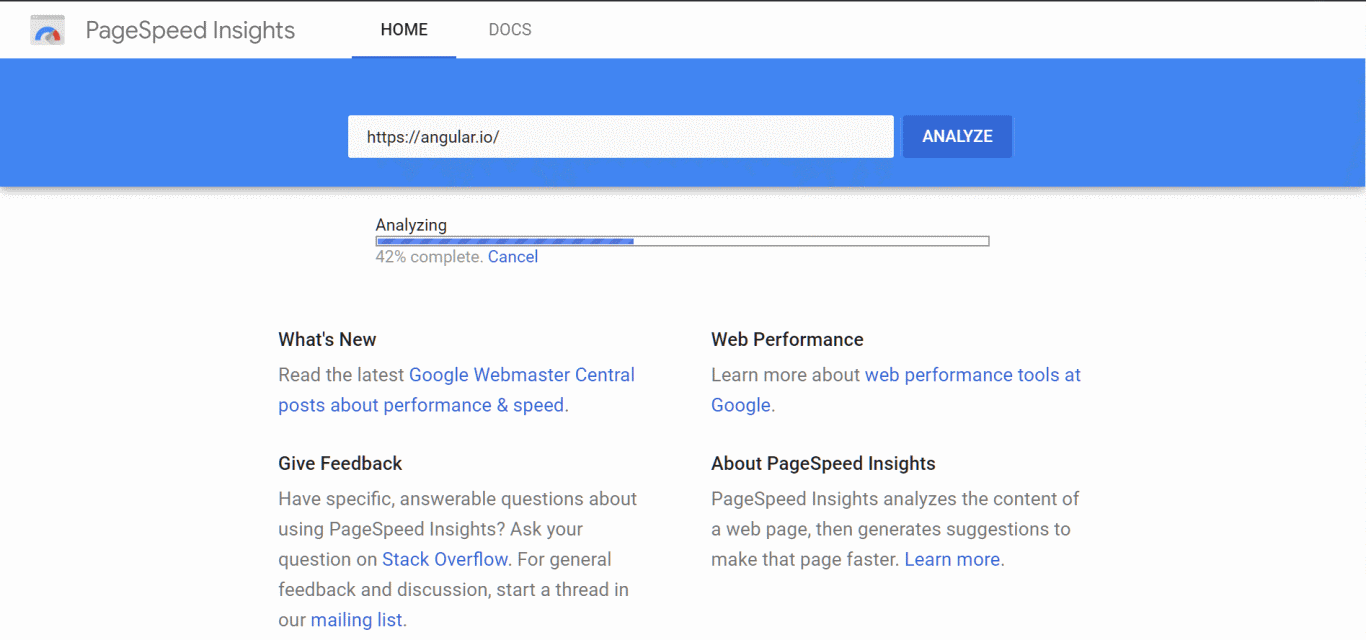
PageSpeed Insights
PageSpeed Insights is an online tool that helps you analyze any website's speed performance and provide multiple audits and suggestions to help the site owner optimize the page's performance and load it faster. Separate mobile and desktop reports are generated when using this tool.
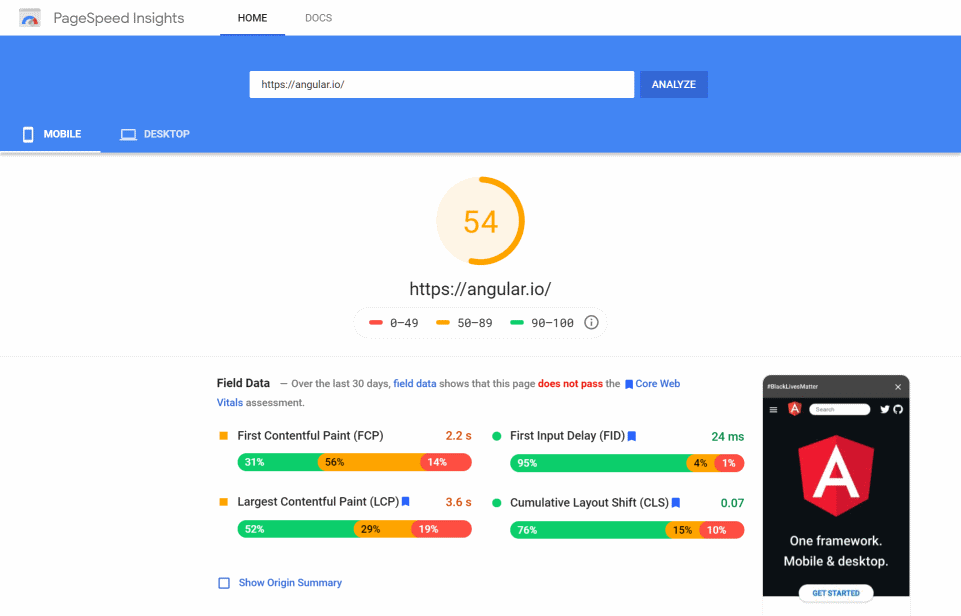
2 datasets are used in the resulting analysis report:
- Field Data: these metrics are collected from real users as they have visited this site (CrUX report data)
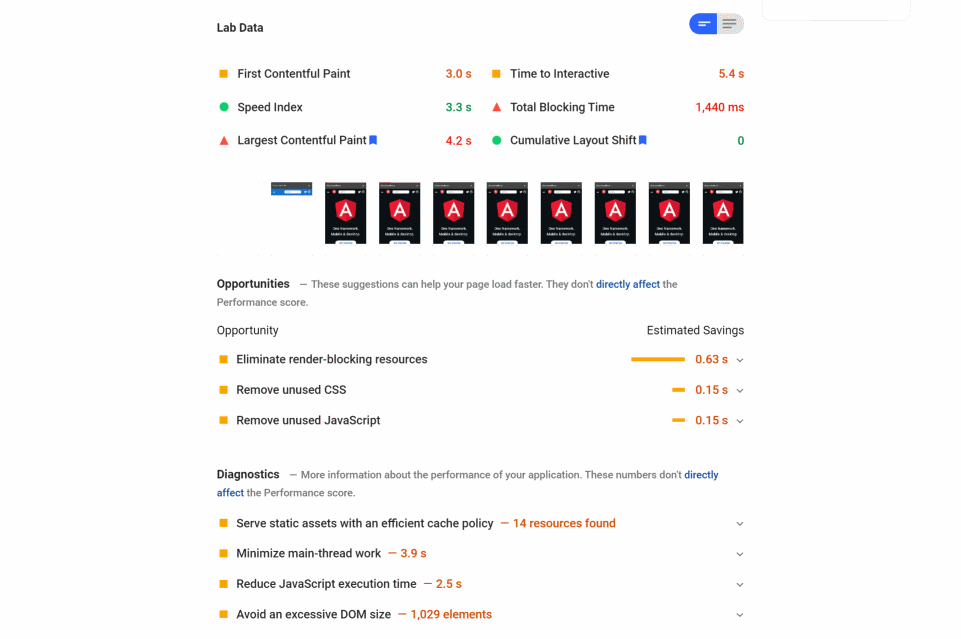
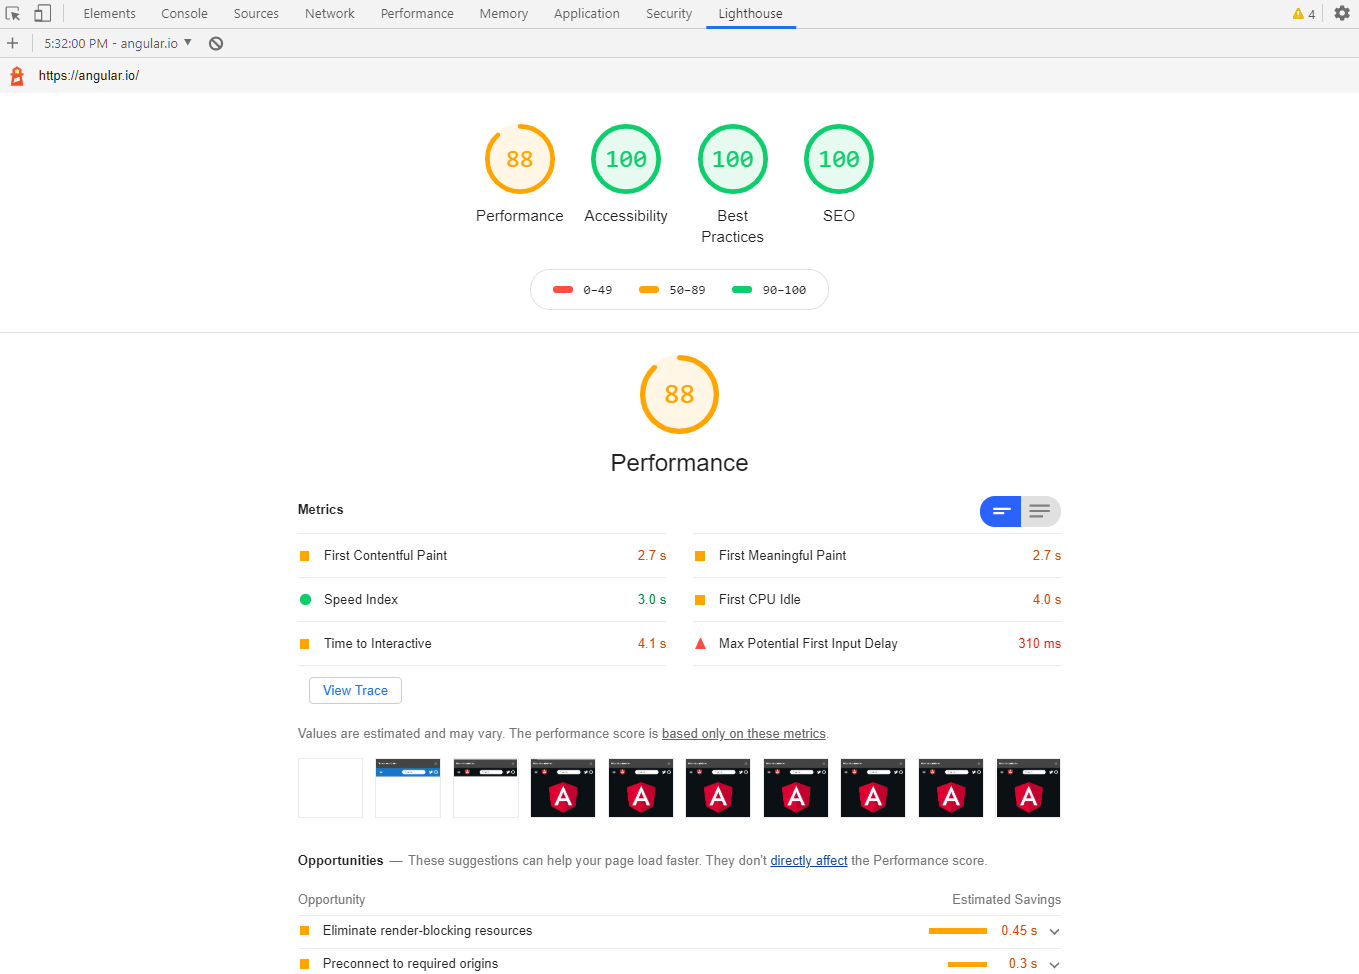
- Lab Data: these are data generated using the Lighthouse tool. Different metrics are collected including:
- First Contentful Paint
- First Meaningful Paint
- Speed Index
- First CPU Idle
- Time to Interactive
- Max potential First Input Delay
The performance score is calculated using the lab data. The page is considered fast if this score is above 90 and slow if below 50.
The Opportunities section provides performance optimization suggestions along with the potential page load gain if they are implemented.
The Diagnostics section provide additional information about how a page adheres to best practices for web development.
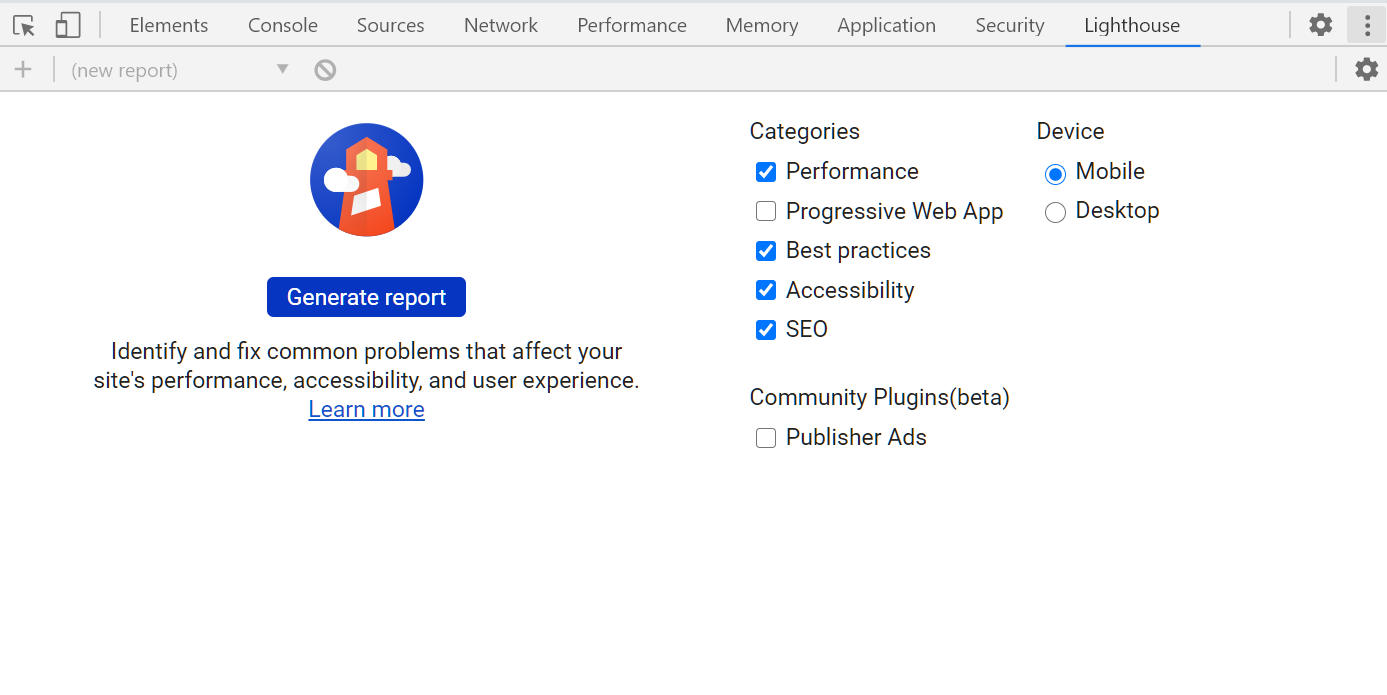
Chrome DevTools
Chrome DevTools is a set of web developer tools built directly into the Google Chrome browser. They can be opened by pressing Control+Shift+C (Windows, Linux, Chrome OS) or Command+Option+C (Mac).
2 tools are particularly helpful to investigate speed issues:
- The Lighthouse panel (or Audits on older Chrome versions) can be used to display performance metrics for the current page using the Lighthouse tool. You can choose the device type, the type of audits to generate and whether CPU and network throttling should be applied. In our case, the Performance audit type should be checked.
- The Performance panel can be used to analyze a web page's load and runtime performance. To get started analyzing your webpage's speed:
- Navigate to the web page
- Open the Performance panel
- CPU and network throttling can be applied to analyze further performance bottlenecks.
- Click on the refresh icon inside the Performance panel to start profiling and reload the page
- All the main tasks (scripting, rendering, ...) will be displayed along with their sub-tasks. You can zoom on the sub-tasks, click on them to display more details (source script for example) and view network and timing events such as First Contentful Paint (FCP). The longest task after the FCP corresponds to the max potential First Input Delay.
Other tools
- Web Vitals extension: real-time Core Web Vitals measurements for Google Chrome
- Web.dev Measure: similar to
PageSpeed Insights

Before applying the following recommendations, you should run a performance Audit using either PageSpeed Insights or the Chrome DevTools's Lighthouse panel. Try to apply all the suggestions when applicable.
First Input Delay (FID)
")
The usual error message displayed on the Google Search Console speed report relating to the FID is: FID issue: longer than 300ms (mobile / desktop).
To minimize the FID, you should reduce the scripting and rendering tasks' time of your page so that each one doesn't block the main thread for too long after the FCP.
- Open the Chrome DevTools Performance panel
- Apply a 4x CPU slowdown to simulate slower devices
- Start profiling and reload the page
- Identify all the sub-tasks that take the longest time.
To reduce the execution time of these sub-tasks:
- Depending on your stack, you can try code splitting
- Try to delay some page initialization to a later time using setTimeout API (analytics, alerts, etc.)
- Use the Idle Until Urgent strategy
- Lazy load page content: images, videos, paging, on scroll loading
- Defer script loading
- If a third-party JavaScript library is the culprit, try an alternative library or write your own solution if possible.
Largest Contentful Paint (LCP)
")
The usual error message displayed on the Google Search Console Core Web Vitals Report relating to the LCP is: LCP issue: longer than 4s (mobile / desktop).
In addition to the optimization suggestions provided in the First Input Delay section, you can try the following tips to reduce the LCP:
- Minify your assets to reduce their size
- Use a Content Delivery Network (CDN) to reduce your page's resources download time
- Benefit from HTTP Caching by adding Cache Headers
- Initialize your page's header area before the other parts (such as the footer and the lower sections)
- Minimize the number of render-blocking external stylesheets
Cumulative Layout Shift (CLS)
")
The usual error message displayed on the Google Search Console Core Web Vitals Report relating to the CLS is: CLS issue: more than 0.25 (mobile / desktop).
Unexpected layout shifts can be avoided by following this guidelines:
- Including the size attributes on the images and video elements. If not possible, CSS aspect ratio boxes can be used to reserve the space they will occupy.
- Not appending content before existing content, unless this is being triggered by a user interaction.
- Prefer transform animations to animations of properties that trigger layout changes. Animate transitions in a way that provides context and continuity from state to state.