Centralize And Monitor Your Application & System Logs On The Cloud For Free
Loggly is a SaaS log management service that offers a unified log analysis and monitoring platform with many DevOps integrations.
Loggly provides setup instructions for a wide array of log sources and platforms. Depending on the log source, Loggly will try to analyse and extract fields that can be used to display & filter logs.
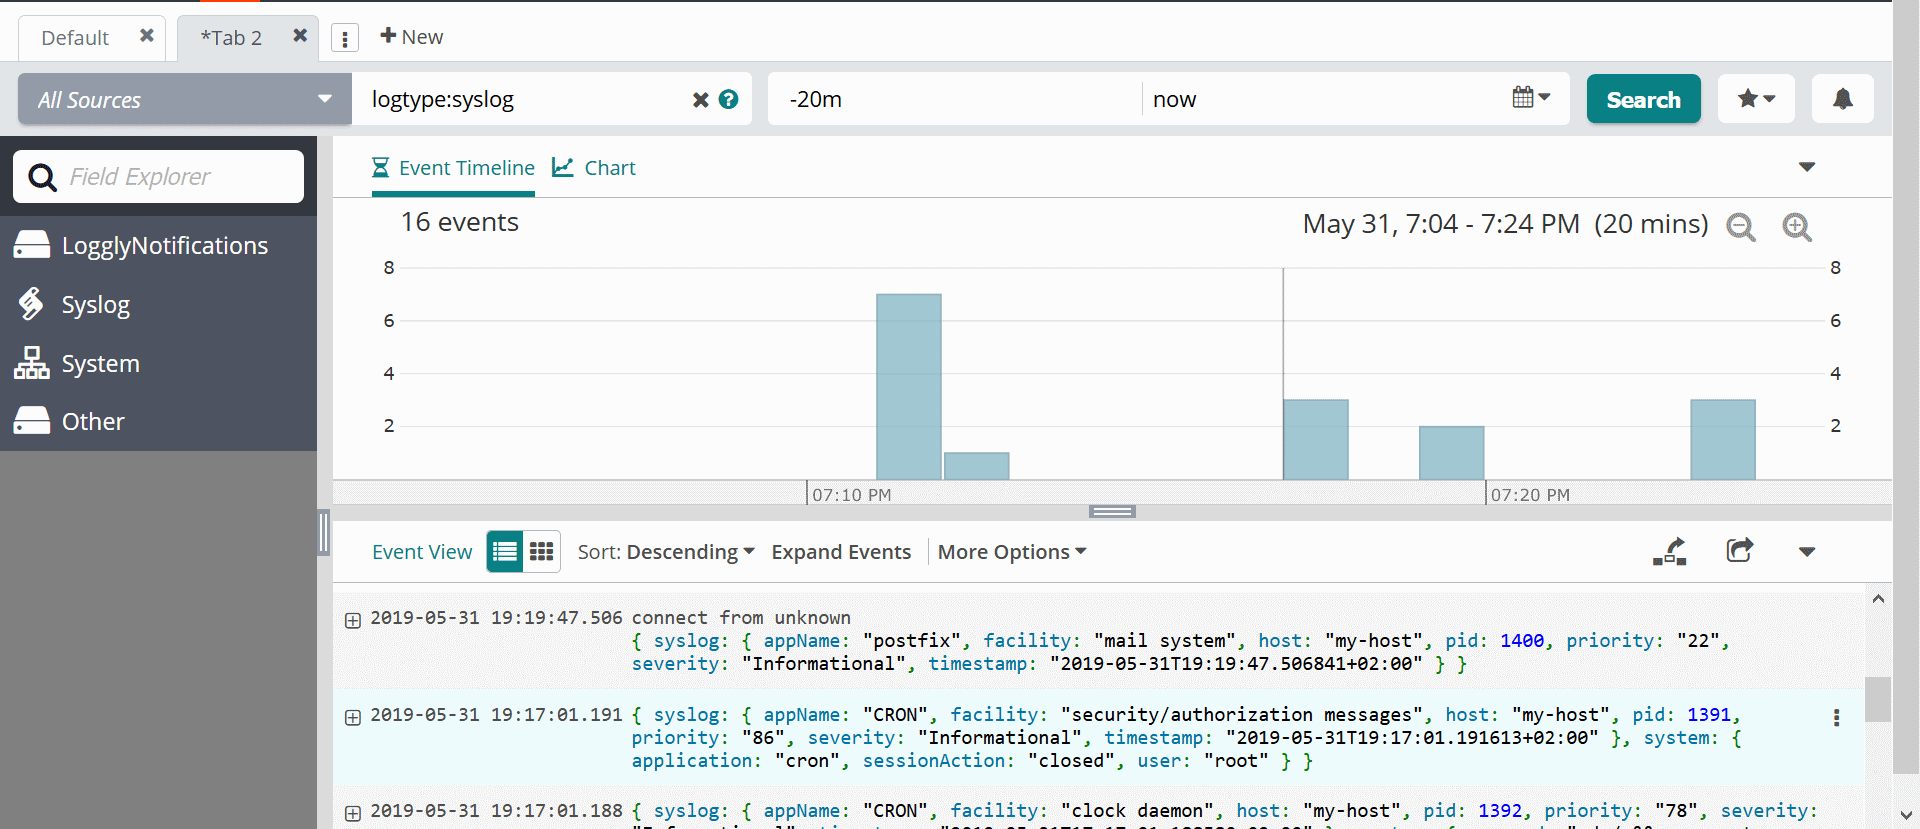
After setting up your log sources, you can monitor your logs from the Search page.
A log event timeline chart is displayed alongside a log listing using one of the following view types:
- Events view: The logs are presented as rows that can be expanded to view more the details
- Grid view: A table view of the logs with custom columns
Logs can be filtered with different criteria depending on the source: severity level, application, host etc.

The standard plan includes:
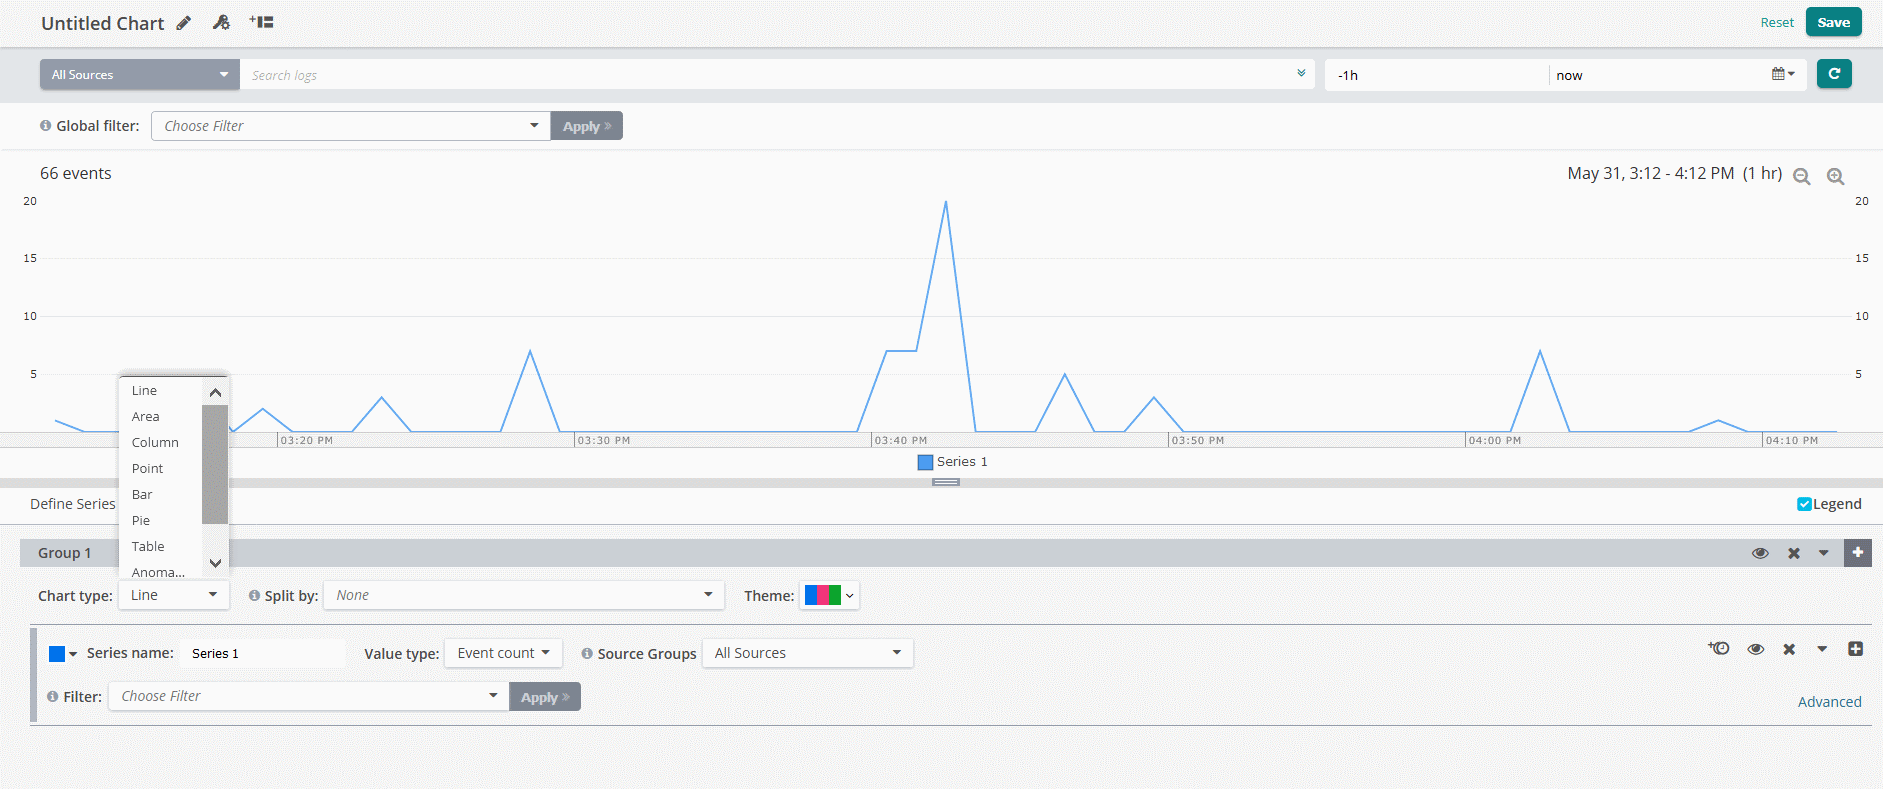
- Dashboards and charts visualization

- Email alerts
The Pro plan includes:
- Parsing rules to create derived fields
- Webhook alerts
- PagerDuty, Slack and HipChat integrations
The Enterprise plan includes:
- GitHub and JIRA Software integration
- Live Tail: near real time log display
Supported log sources
Android, Angular JS, Apache, AWS, Browser File Upload, Chef, Command Line File Upload, Cron, Django, Docker, Flash, FluentD, Heroku, HTTP/S Bulk Endpoint, HTTP/S Event Endpoint, IIS, iOS, Java (Log4j, Logback), Javascript, Linux, Logstash, Mac, MongoDB, MS SQLServer, MySQL, .NET, Network Devices and Routers, Nginx, Node.js, PHP, PostgreSQL, Puppet, Python, Rsyslog, Ruby, Syslog Endpoint, Syslog-ng, Tomcat, Tracking Pixel, Unity 3D, Webhooks, Windows
Free plan limits
- Log capacity: 200 MB / day
- Log retention: 7 days
- Users: 1
- No Live Tail (available in the Enterprise plan)
- No Alerts (available in paid plans)
Tips
- You can use the
-xx<unit>format either on thefrominput or thefromquery parameter of on the search page to indicate the starting time of the displayed log events:xx: number<unit>:sfor seconds,mfor minutes,hfor hours,dfor days
- The
untilinput / query parameter supports the same format in addition tonowthat can be used to indicate the current time.
Logz.io is a cloud based log management service based on the ELK (Elasticsearch, Logstash, Kibana) stack.
To connect your log source, detailed instructions are available for many platforms in the Log Shipping page.
After setting up your log sources, navigate to the Kibana page to start monitoring your application:
- From the
Discovertab, you can visualize and filter your logs and create alerts. - Display and create visualizations using the
Visualizetab. - Display and create dashboards using the
Dashboardtab.
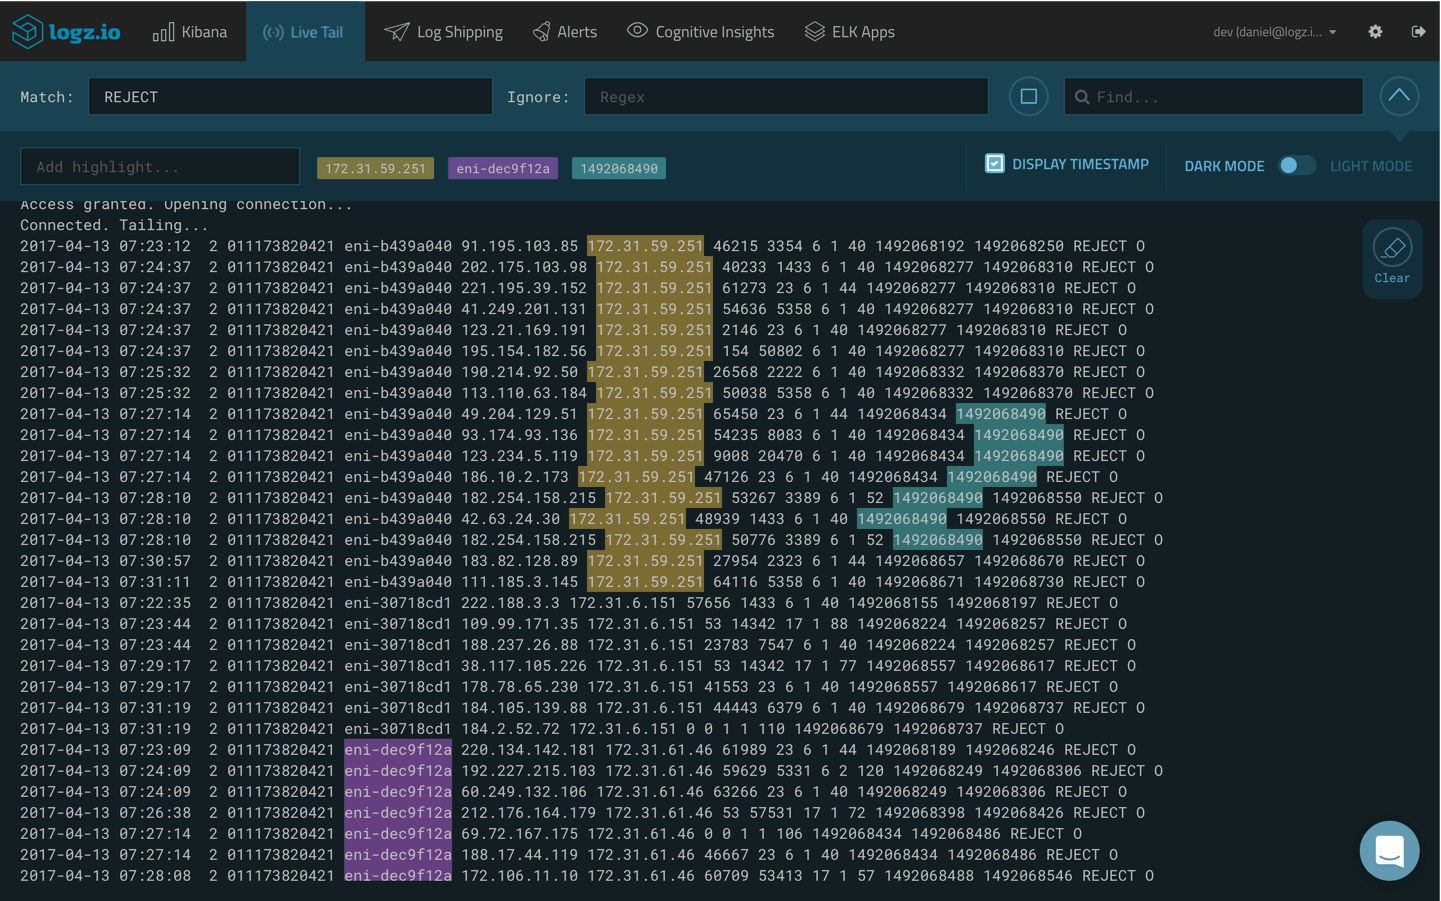
Near real-time log data can be viewed and filtered from the Live Tail page.
A library of visualizations, dashboards, searches and alerts can be installed for free from the ELK Apps page.
Supported log sources
AWS, Apache, Azure, Beats, Bulk HTTP/S, Cloud Foundry, Docker, .NET (NLog Target, log4net Appender), File Upload (cURL), Filebeat, Fluentd, GitLab, Go, HAProxy, Heroku, IIS, Java (log4j2 & logback appenders), Jenkins, JMX, Kubernetes, Linux, Logstash, MySQL, Network Device, Nginx, Node.js, Puppet, Python, Rsyslog, Ruby, TLS/SSL TCP, Windows, Zipkin
Free plan limits
- Log capacity: 3 GB / day
- Log retention: 3 days
- Users: 50
- Live Tail: 1 concurrent
- Alerts: 50
